Tips for Investigating Your Website Traffic
Mysteries have their place—in movies, books, and plays. The amount of traffic directed to a website from an e-blast or a Facebook post should not be a mystery.
When the purpose of an e-blast is to reach potential new members or subscribers with the hopes of some type of registration or sign-up, following through on how that traffic engaged with your website is an important piece of the conversion process.
Luckily with Google Analytics it is possible to see how traffic from an e-blast link has navigated through your website. In order to accomplish this, a “campaign tag” needs to be added to the hyperlink in your post or e-blast.
Create a Campaign Tag
Here at AMC, we create our campaign tags with the help of Google’s URL builder tool. There are three required pieces (UTM tags) that allow the tracking to occur.
1. The “campaign source” should indicate where the link was placed (e.g., blog, name of your e-mail service, Facebook).
2. The “campaign medium” explains what type of communication held the link (e.g., e-blast, banner-ad).
3. The “campaign name” is a name you have given the overall campaign (e.g., newcareerpage or conference2016).
For consistency in reporting it’s a good idea to use all lowercase when creating these tags. Once the steps in the URL builder are complete, the newly created UTM link can be used instead of the plain URL as a hyperlink in your e-blast or on Facebook.
Here’s an example based on another AMC blog post:
Before: http://connect2amc.com/29-seismic-shift
After (with UTM tags): http://connect2amc.com/29-seismic-shift?utm_source=facebook&utm_medium=100615post&utm_campaign=blog
Segment Your Traffic
In your Google Analytics account you can segment the traffic from these links by campaign name to get a better idea of how the visitors to your site traveled after reaching the initial page to which the link directed them. Here’s how:
- Within the Acquisition menu, select the user flow option.
- Then select dimension—>advertising.
- Finally, select the subset “campaign.”
Traffic will then be categorized by campaign. Be sure to adjust the date range in your analytics screen to accommodate the time period that the campaign was running.
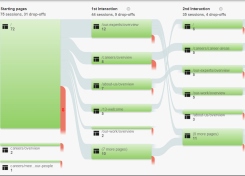
By viewing the user flow diagram you will be able to see if some of the traffic from the campaign continued on to additional pages of your website (yay!) or if the traffic dropped off after the initial page. Knowing this information about your visitor engagement should help you make decisions about future post and e-blasts, along with the content on your website.
Visitor Traffic is No Secret
In the case of one of AMC’s clients, campaign tagging showed that a recent Facebook post directed visitors to a lower-level page on the client’s website and the user flow diagram (after choosing the dimension steps listed above) showed that most of the traffic left the website right after the page they landed on. Was the page missing a call to action? Would a different set of visitors from a different “campaign source” engage with the site differently?
Seeing the results in the user flow diagram provides information that can be used to decide to either adjust the content on the page in question or try the link again with a different set of potential visitors. Continue to check your results as you try new posts and links. Segment your traffic once again and check the user flow diagram. These steps will help you determine which source of visitors are more engaged.
By leveraging these free tools and taking these steps, you can keep the mysteries in detective novels - not on your website.